 I have designed a musical instrument that exploits this topology.
An application of the 3D library to visualizing a graph embedded in a surface (the torus) where it has zero crossing number.
We start with the example of the graph H12 which represents the topology of a musical string instrument’s fingerboard.
This graph would look better on a donut, or torus, because of the periodicity of the fingerboard in both directions. Below we see some 3D views of this.
I have designed a musical instrument that exploits this topology.
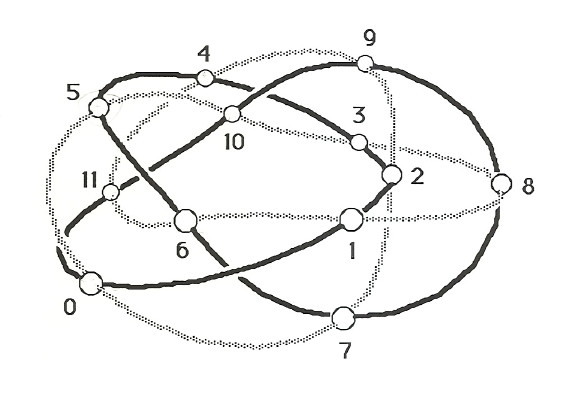
Here is another way of drawing the graph, with the understanding that opposite edges are supposed to be joined.
The way it wraps around looks like the following two steps:
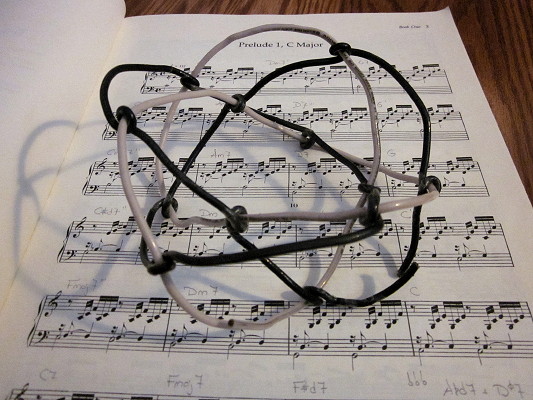
At first, I made a model on a child’s plastic torus. (Wish I had a photo of that.) Then I constructed the next model with solid-core electrical wire, shown here.
The next question was: how to get a decent illustration for technical writing about this object? I was studying projective geometry at U.C. Santa Cruz anyway, so I dug in and wrote some 3-D graphics code in Turbo Pascal for Mac OS 7 (or so). Here are the results of the first wrap and second wrap.
 ➠
➠
Those illustrations got used in this paper. As time passed, that code got ported to HyperTalk, JavaScript, Dart, and Swift.